1、下载插件
1
| npm i hexo-butterfly-charts --save
|
2、配置主题配置文件
1
2
3
4
5
6
7
8
9
10
11
12
| charts:
enable: true
postsChart:
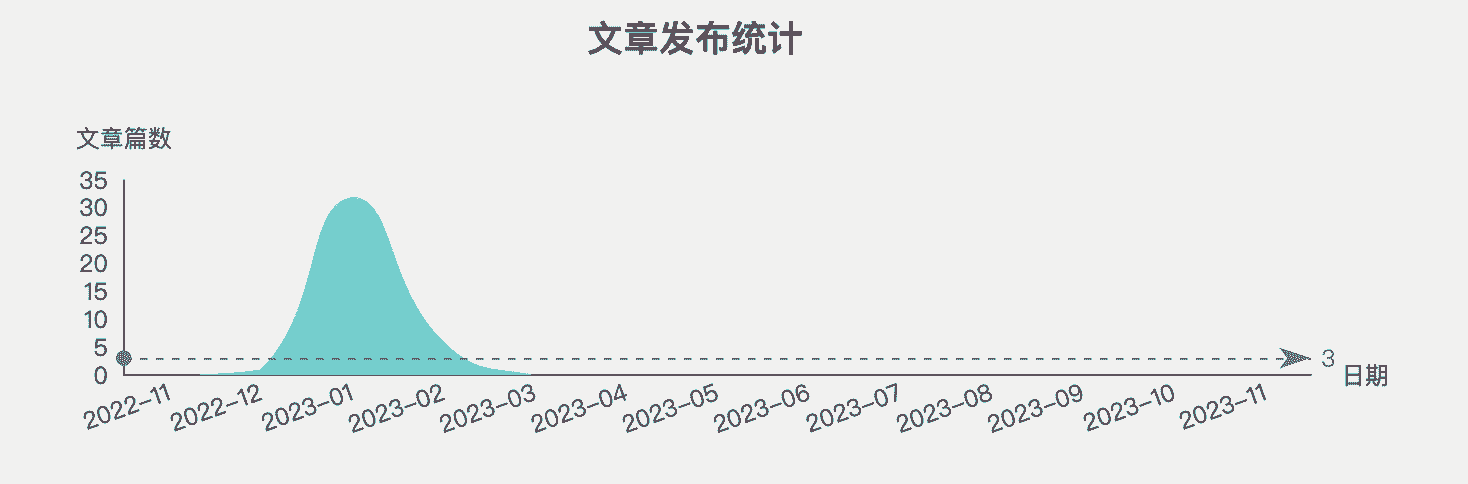
title: 文章发布统计
interval: 0
tagsChart:
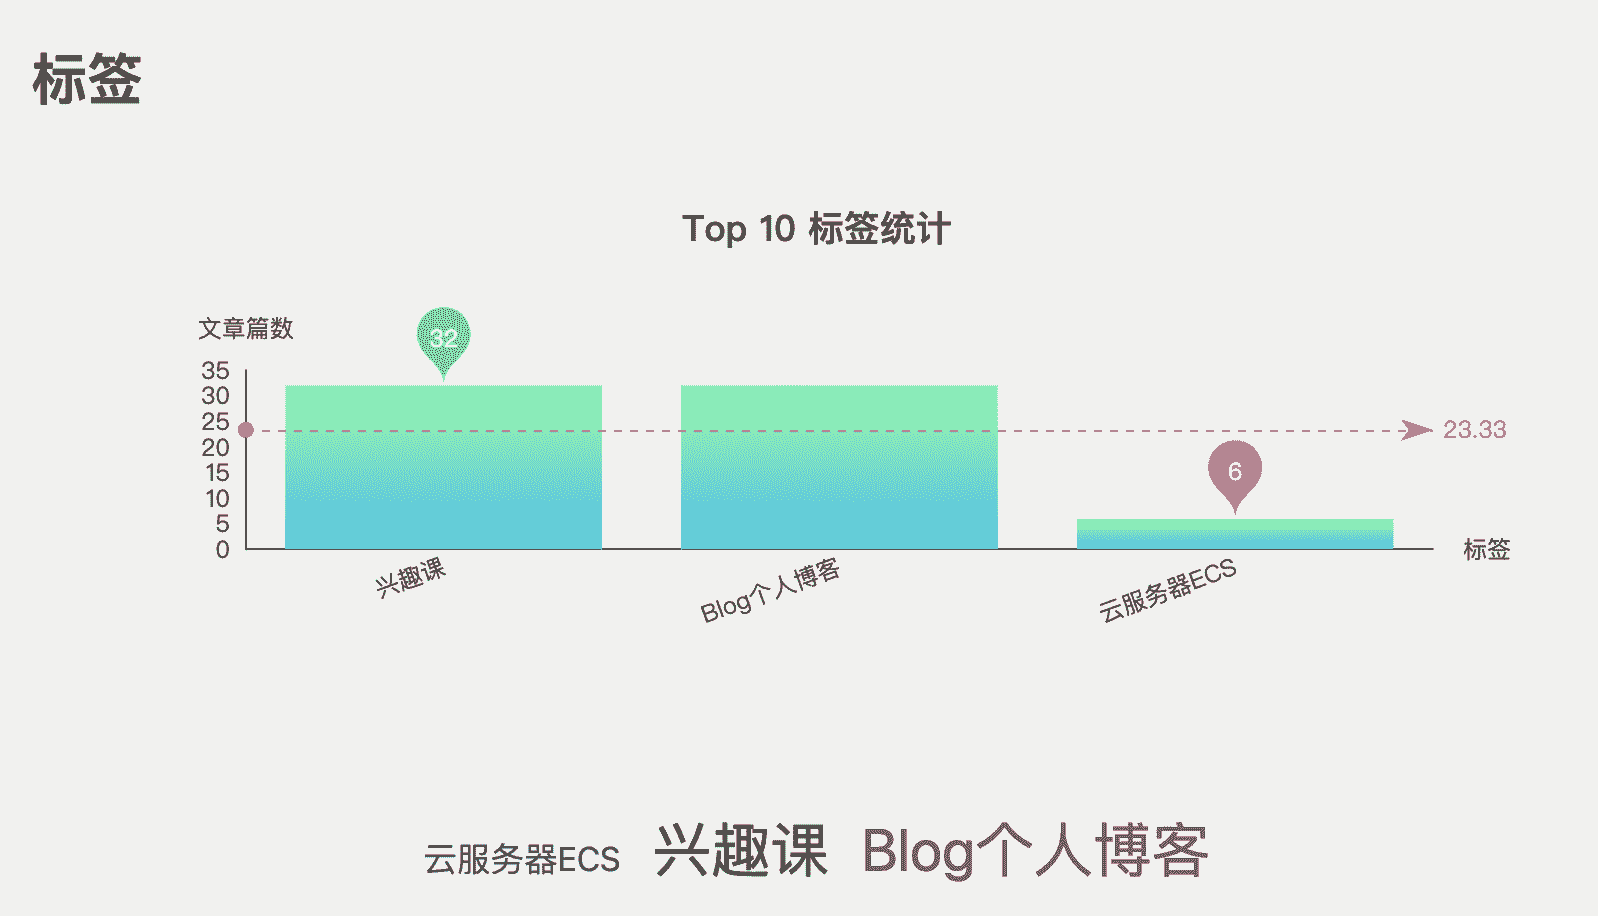
title: Top 10 标签统计
interval: 0
postsCalendar_title: 文章发布日历
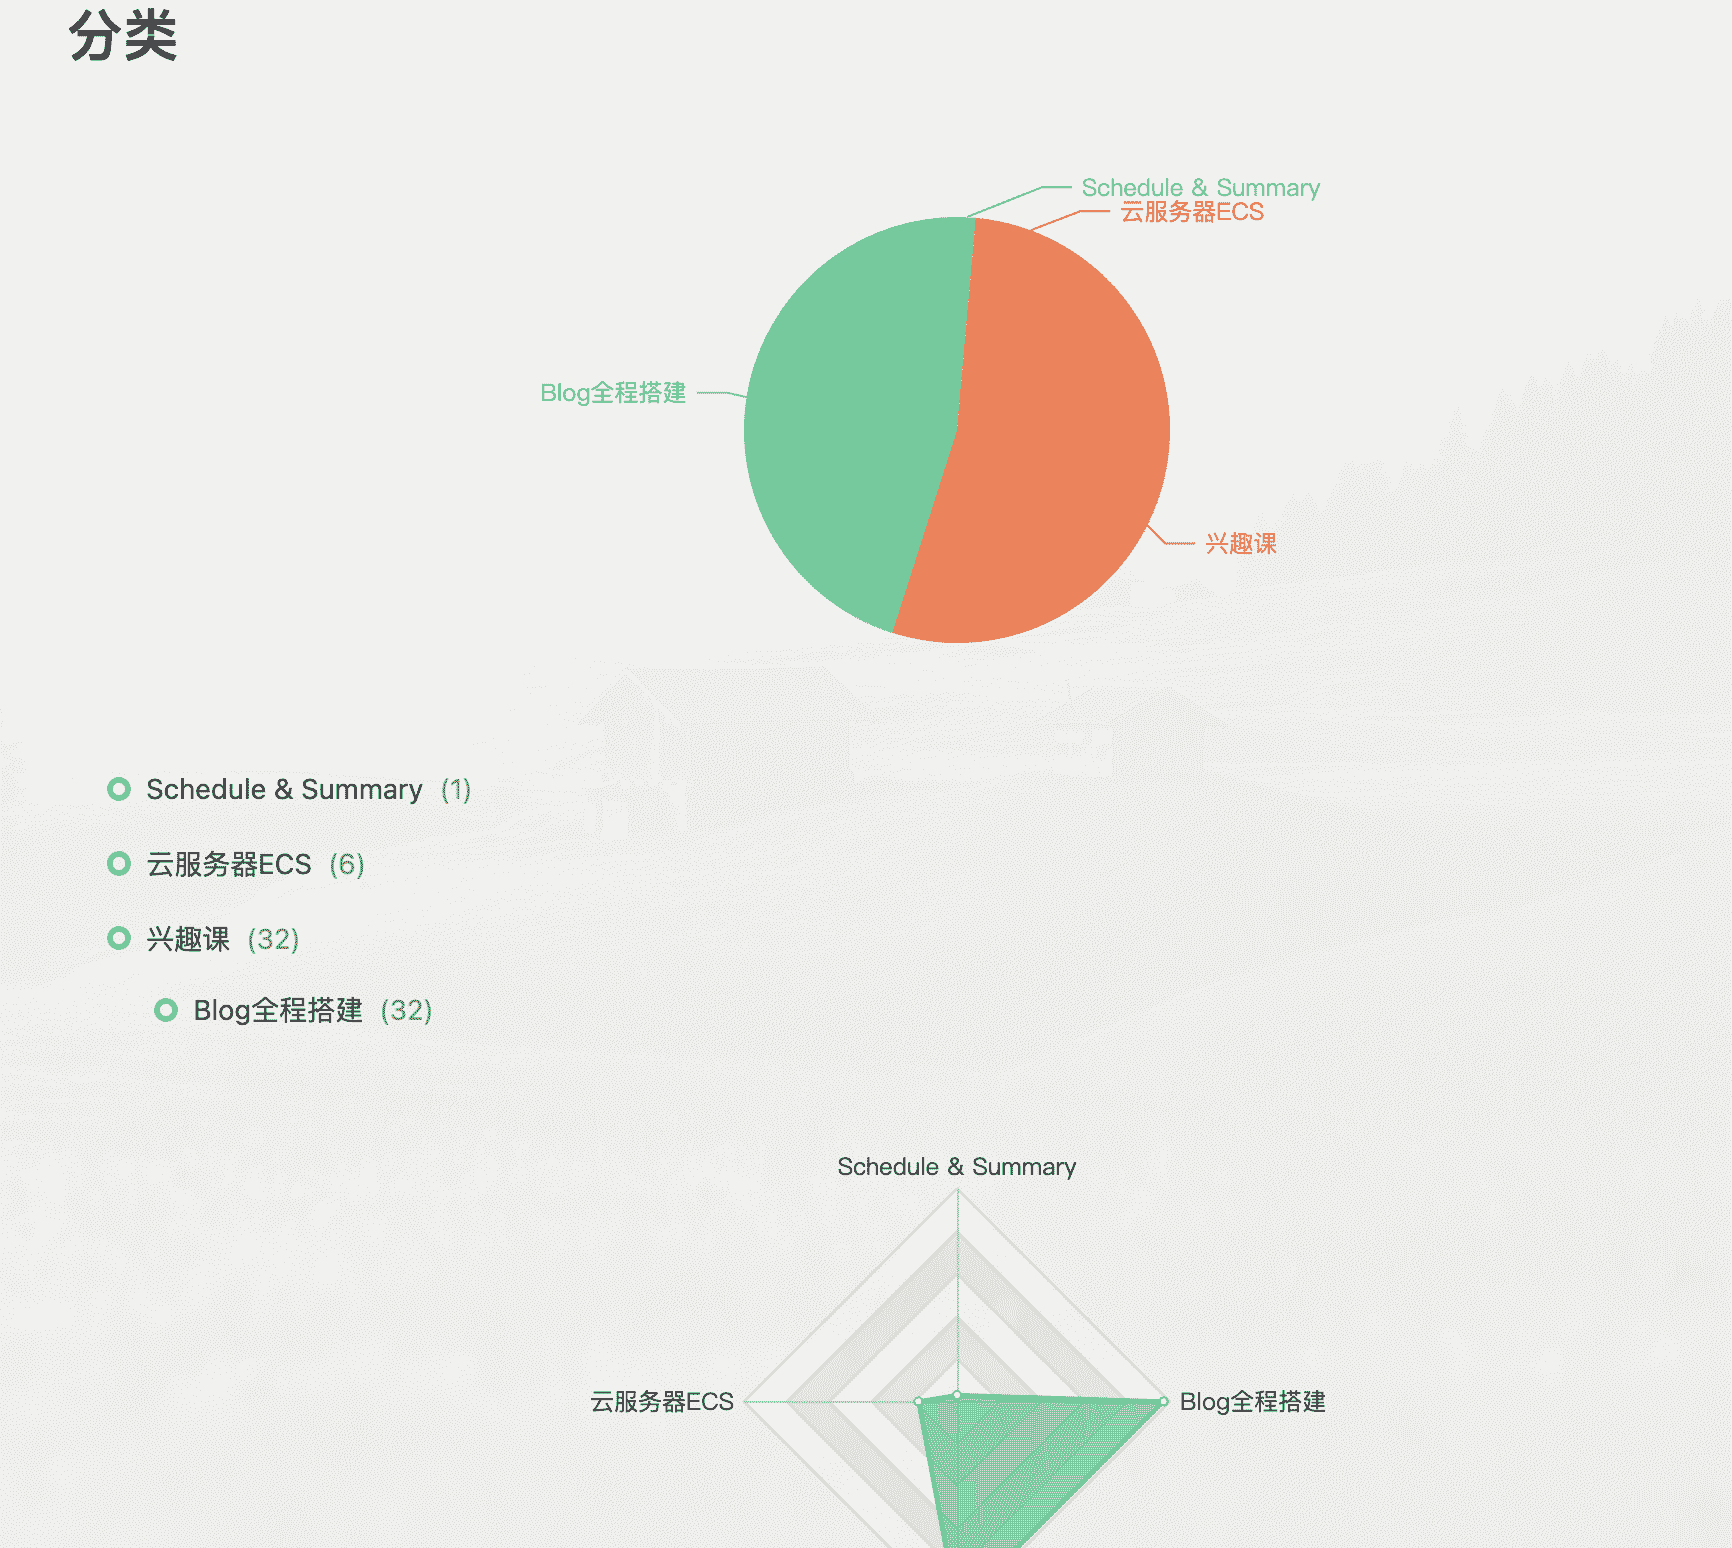
categoriesChart_title:
categoriesRadar_title:
echarts_CDN: https://lib.baomitu.com/echarts/4.7.0/echarts.min.js
|
3、在各页面配置
安装插件后,在/Butterfly/layout/archive.pug文件中,#archive下面添加一行#posts-calendar.js-pjax发布日历(#posts-chart.js-pjax 发布统计), 新添加的比上一行多缩进两个空格。
1
2
3
4
5
6
7
8
9
| extends includes/layout.pug
block content
include ./includes/mixins/article-sort.pug
#archive
#posts-calendar.js-pjax
.article-sort-title= `${_p('page.articles')} - ${getArchiveLength()}`
+articleSort(page.posts)
include includes/pagination.pug
|

编辑主题目录/Butterfly/layout/includes/page/categories.pug文件,在第1行添加#categories-chart.js-pjax和#categories-radar.js-pjax。
1
2
3
| #categories-chart.js-pjax
.category-lists!= list_categories()
#categories-radar.js-pjax
|
编辑主题目录/Butterfly/layout/includes/page/tags.pug文件,在开头添加一行#tags-chart(data-length = “10”).js-pjax,data-length = “10”表示显示 Top 10 的标签。
1
2
3
| #tags-chart(data-length = "10").js-pjax
.tag-cloud-list.is-center
!=cloudTags({source: site.tags, orderby: page.orderby || 'random', order: page.order || 1, minfontsize: 1.2, maxfontsize: 2.1, limit: 0, unit: 'em'})
|
4、在其他页面配置
直接在markdwon文档页面里添加下面的五个个标签(任意一个),就可以添加相关的统计图
1
2
3
4
5
6
7
8
| <div id="posts-calendar" class="js-pjax"></div>
<div id="posts-chart" class="js-pjax"></div>
<!-- "data-length" = how many tags to show, default 10 -->
<div id="tags-chart" data-length="10" class="js-pjax"></div>
<div id="categories-chart" class="js-pjax"></div>
<div id="categories-radar" class="js-pjax"></div>
|
 微信
微信 支付宝
支付宝